The Ultimate Guide to Conversion Rate Optimisation Best Practices

Kyle Eggleston
Chicago SEO Consultant since 2004LinkedIn

On this page
Why Most Websites Leave Revenue on the Table
Applying conversion rate optimisation best practices is one of the highest-ROI moves any business can make — yet most websites ignore it completely.
Here are the core best practices at a glance:
- Use data, not opinions — teams running data-informed experiments win 20–30% of the time vs. 10% for guesswork
- Test one element at a time — headlines, CTAs, form fields, and page speed first
- Fix checkout friction — 70% of ecommerce visitors abandon their carts
- Optimise for mobile — 76% of U.S. adults buy on smartphones
- Build trust signals — testimonials, reviews, and security badges near your CTA
- Personalise the experience — personalised CTAs perform 202% better than generic ones
- Run a structured CRO program — investigate, research, optimise, and evaluate in a continuous cycle
The average website converts only 2.35% of visitors. The top 10% convert at over 11%. That gap isn’t luck — it’s the result of systematic testing and iteration.
Most small businesses focus entirely on driving more traffic. But if your site converts at 1.5%, doubling your ad spend just doubles your cost — not your revenue. Fixing what’s already broken on your site is almost always the faster path to growth.
I’m Kyle Eggleston, an SEO and digital strategy consultant who has helped enterprises and small businesses implement conversion rate optimisation best practices that turn existing traffic into measurable revenue gains. In this guide, I’ll walk you through the exact frameworks, tactics, and processes that move the needle.
Why Data-Driven Experimentation Beats Opinion-Based Changes
If we gathered ten people in a conference room in downtown Chicago and asked them how to improve a website’s homepage, we would get eleven different opinions. The designer wants more whitespace. The copywriter wants longer storytelling. The product manager wants a giant video.
In the traditional digital marketing world, the HiPPO (Highest Paid Person’s Opinion) usually wins. But in the real world of June 2026, relying on gut feelings is a recipe for stagnant growth.
True conversion rate optimisation (CRO) is a scientific discipline. When we swap out opinion-based changes for rigorous, data-driven decisions, we completely transform our business trajectory. The data is clear: teams that use real customer data to inform their experiments win roughly 20–30% of the time. In contrast, teams that experiment with uninformed ideas or pure intuition win only 10% of the time. By grounding your roadmap in quantitative and qualitative research, you instantly double or triple your probability of finding a winning variation.
Building a sustainable culture of experimentation means accepting that your website is a living, breathing laboratory. Instead of launching massive, risky site redesigns every three years—which often fail because agencies skip the critical behavioral analysis steps—successful brands make continuous, incremental improvements.
For example, the Danish hardware retailer Carl Ras saw a 20% increase in conversion rate through incremental improvements tested systematically via A/B testing. They didn’t rewrite their entire business model overnight; they validated small adjustments one by one. To truly scale your business, you must treat experimentation not as a temporary marketing campaign, but as permanent infrastructure.
Learn more about conversion rate optimization to understand how setting up these systematic experiments can help your business move from guessing to knowing.
The Value of Failed and Inconclusive Tests
One of the biggest mental hurdles teams face when adopting conversion rate optimisation best practices is the fear of failure. If an A/B test doesn’t yield a statistically significant lift in your primary metric, was it a waste of time?
Absolutely not. In a true culture of experimentation, there are no failed tests—only learning opportunities.
When a test is inconclusive or flat out loses, it provides invaluable customer insights. An inconclusive test tells you that your audience simply doesn’t care about the element you changed. Did you spend three weeks debating whether a button should be navy blue or teal, only for the test to show 0.0% difference? Excellent—now you know that button color isn’t a conversion blocker, and you can redirect your team’s energy to high-leverage elements like your value proposition or pricing structure.
A losing test is equally protective. Imagine if you had implemented a new, forced account creation step on your checkout page without testing it first. If you had just pushed it live based on an executive’s opinion, you might have permanently damaged your revenue. By running it as an A/B test and watching conversions plummet, you prove scientifically that the change hurts the user experience. You can turn off the test, save your revenue, and document the learning.
Adopting this test-and-learn mindset shifts your team’s perspective. Every test you run builds a proprietary library of insights about your specific audience’s behaviors, anxieties, and motivations. Over time, these compiled learnings make your future hypotheses progressively sharper and more accurate.
Implementing Conversion Rate Optimisation Best Practices for Sustainable Growth
To build a high-converting digital experience, we have to look at the entire user journey. A visitor doesn’t just land on your site and magically buy; they move through a conversion funnel that must carefully transition them from initial interest to decisive action.
Along this funnel, visitors encounter friction points—or conversion blockers—that cause them to drop off. Common blockers include a lack of pricing transparency, overwhelming navigation layouts, unclear labeling, superficial copy, and insufficient product information.
To overcome these blockers, we must deploy proven trust signals and clear, context-aware calls to action (CTAs). Trust is one of the top three buying factors for modern consumers. If your checkout page or lead form lacks security badges, clear privacy guarantees, or real-time social proof, visitors will abandon your site at the exact moment they should be converting.

Landing Page Conversion Rate Optimisation Best Practices
Your landing pages are the workhorses of your paid campaigns. If you are spending hard-earned budget on Google Ads or Meta campaigns only to send that traffic to your homepage, you are burning cash. In fact, 77% of businesses make the mistake of sending paid traffic to a generic homepage rather than a dedicated, optimized landing page.
To maximize your landing page performance, we recommend focusing on these core pillars:
- Tight Message Match: The single most impactful conversion variable is the connection between your ad copy and your landing page headline. If a user clicks an ad promising “Affordable Chicago Dental Implants” and lands on a page that says “Welcome to Our Family Practice,” they experience cognitive dissonance and bounce. Match your headline language exactly to the search and ad intent. The team at TruckersReport boosted opt-ins by 21.7% primarily by revising their landing page headline to align perfectly with user expectations.
- A Single, Focused CTA: Landing pages with multiple competing offers or navigation links distract users. Research shows that landing pages with a single focused CTA convert 266% better than pages with five or more options. Keep your visitors focused on one clear path.
- Drastic Form Field Reduction: Every form field you add acts as a speed bump. While it’s tempting to collect as much data as possible, reducing form fields from 11 to 4 has been shown to increase conversions by 120%. If you must collect extensive data, use progressive profiling or multi-step forms that leverage the psychological principle of consistency (the Breadcrumb Technique), getting users to accept small requests before presenting larger ones.
- Strategic Social Proof: Place specific, outcome-oriented testimonials directly adjacent to your primary CTA. A testimonial that says “This tool saved us 12 hours a week” is infinitely more powerful than one that says “Great service!” Products with five or more reviews convert 270% better than those with none.
Discover effective conversion rate optimisation best practices to see how optimizing these layout and copy elements can dramatically lower your acquisition costs.
Technical and Mobile Conversion Rate Optimisation Best Practices
You can have the most persuasive copywriting and beautiful design in the world, but if your site takes forever to load or breaks on a smartphone, your conversion rate will suffer.
Technical performance is the foundation of the user experience. A site that loads in one second converts three times better than a site that loads in five seconds. Portent’s research confirms a 7% conversion drop for every single second of delay. Google’s Core Web Vitals—specifically Largest Contentful Paint (LCP), First Input Delay (FID), and Cumulative Layout Shift (CLS)—are no longer just SEO ranking factors; they are critical conversion metrics.
Furthermore, mobile optimization is no longer optional. Over 60% of the global internet population uses a smartphone to browse online, and 76% of U.S. adults make purchases using their mobile devices. Yet, mobile conversion rates historically average less than half of desktop rates due to poor UX design.

To optimize for the mobile shopper, simplify your navigation. Unbelievably, 82% of online stores fail to divide their navigation into manageable chunks, leaving mobile users drowning in massive dropdown menus.
We must also eliminate checkout friction entirely. The average shopping cart abandonment rate hovers around 70%, with 18% of users abandoning purchases due to checkout complexity. On mobile, this friction is magnified.
To combat this, enable guest checkout as the default option—forcing users to create an account before buying reduces conversions by up to 24%. Implement address lookup validators (47% of sites currently lack them) and auto-format credit card fields with spaces to prevent input errors. Finally, integrate digital wallets like Apple Pay and Google Pay; one-click payment solutions can increase mobile conversions by 50% to 80% by removing the need to manually type out credit card details on a tiny screen.
How to Structure a Systematic CRO Program
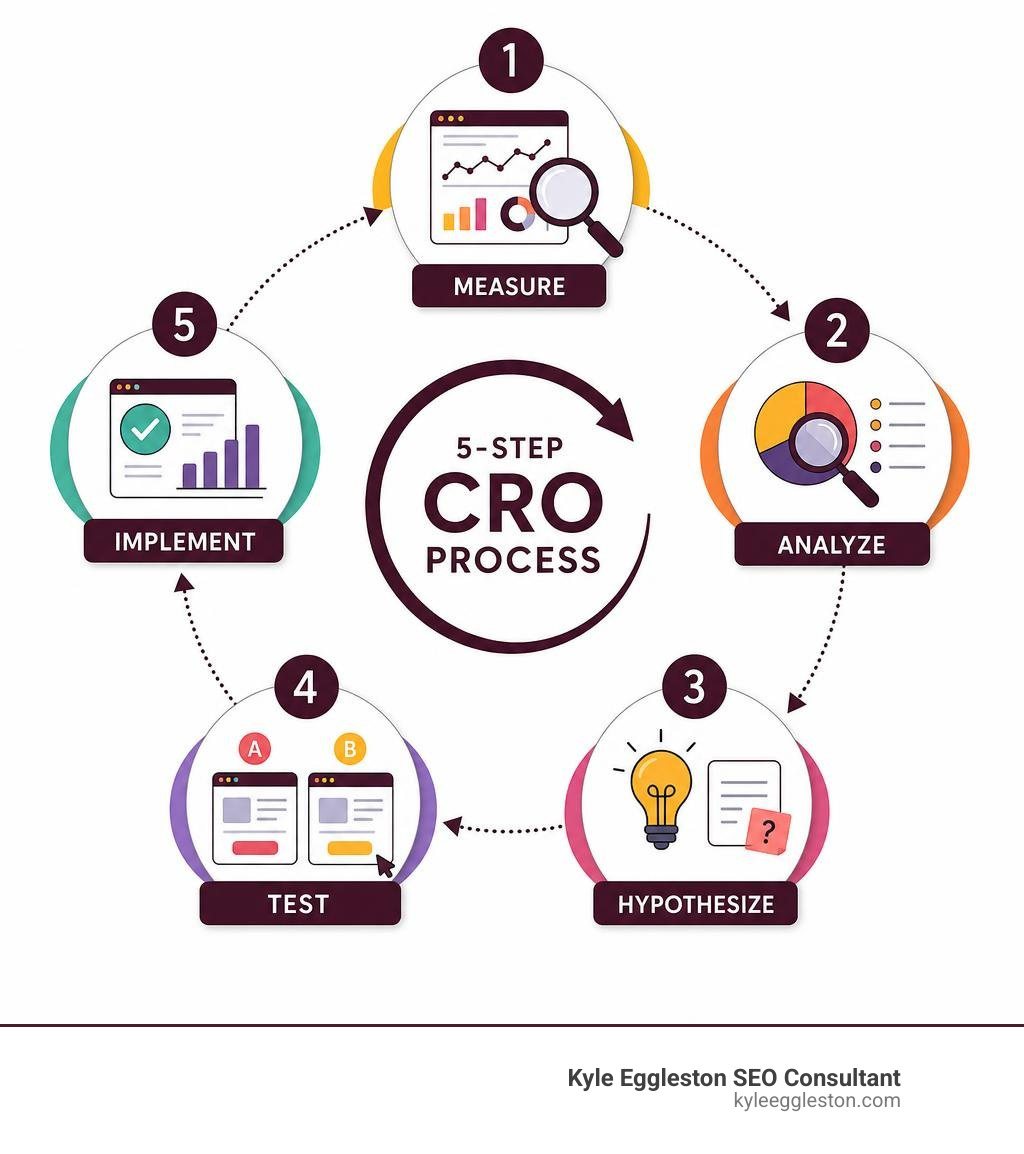
To move away from one-off “hacks” and build a scalable growth engine, we must structure a systematic, repeatable CRO program. This program is a continuous, circular process consisting of four primary phases:
- Investigation: Analyze your baseline analytics data, map your user journeys, and identify where the largest drop-offs are occurring in your conversion funnel.
- Research: Combine quantitative data (heatmaps, scroll maps, form analytics) with qualitative insights (user testing, customer surveys, exit-intent polls) to understand why users are dropping off. Quantitative data tells you where the leak is; qualitative data tells you how to plug it.
- Optimization: Formulate clear hypotheses and design targeted experiments to address the friction points you uncovered.
- Evaluation: Analyze your test results, calculate statistical significance, implement the winning variations, and document your learnings to feed back into the Investigation phase.
This program should be a collaborative effort involving cross-functional teams. You need input from marketing (for copywriting and positioning), design (for user experience and visual hierarchy), development (for technical execution and site speed), and analytics (for precise tracking).
To keep this team aligned and productive, maintain a flexible experimentation roadmap. You cannot test everything at once, so you must prioritize your ideas. While many teams use the standard ICE model, we often recommend the more robust EPIC framework to score and rank hypotheses.
Prioritization Framework Comparison
| Metric | ICE Framework | EPIC Framework |
|---|---|---|
| Focus | Simplicity and rapid internal scoring. | Delivery-tested prioritization for real-world impact. |
| Components | Impact, Confidence, Effort. | Experiment Value, Priority, Impact, Cost. |
| Scoring Method | Average score of 1–10 across the three elements. | Weighted scoring prioritizing user value and resource cost. |
| Best Used For | Small teams looking for quick-win ideas. | Structured programs managing complex, cross-functional tests. |
Using a structured matrix ensures you prioritize high-leverage tests—like clarifying your primary value proposition or streamlining checkout forms—over low-impact tweaks like button color variations.
Defining and Tracking Key CRO Metrics
To measure the ROI of our optimization efforts, we must track the right key performance indicators (KPIs). Relying solely on your sitewide conversion rate can be misleading, as it can fluctuate based on traffic sources, seasonal promotions, or changes in ad spend.
Instead, track a balanced mix of macro and micro metrics:
- Macro Conversion Rate: The percentage of visitors who complete your primary business goal (e.g., making a purchase, booking a demo, or submitting a lead form).
- Micro Conversion Rates: Step-by-step funnel progression rates, such as add-to-cart rates, cart-to-checkout rates, and form field completion rates. Over 92% of all optimization experiments target these five core metrics: CTA clicks, revenue, checkout progression, registration, and add-to-cart actions.
- Bounce Rate & Exit Rate: Identifying which pages have high traffic but non-trivial drop-off helps you pinpoint where your conversion blockers live.
- Average Order Value (AOV): CRO isn’t just about getting more people to buy; it’s also about maximizing the value of each transaction. Revamping your product display pages—as the dental brand Quip did to achieve a 4.7% increase in order conversion rate—often involves optimizing upsell and cross-sell placements to lift AOV simultaneously.
- Revenue per Visitor (RPV): The ultimate metric for measuring CRO success. RPV combines conversion rate and AOV, showing you the direct financial impact of your optimization program.
Frequently Asked Questions About CRO
What is a good conversion rate for a website in 2026?
A “good” conversion rate is highly dependent on your industry, business model, and traffic sources. Across all industries, the global median landing page conversion rate sits around 2% to 5%.
In the B2B SaaS space, average conversion rates hover around 3%, while highly optimized e-commerce stores typically target 2.5% to 4%. However, top-performing websites in the top 10% frequently achieve conversion rates above 11% by leveraging advanced personalization, dynamic content, and highly structured testing programs. Rather than obsessing over external benchmarks, your primary goal should be to continuously beat your own historical baseline.
How long does it take to see results from CRO experiments?
While quick wins—like fixing a broken mobile button or displaying shipping costs upfront to prevent cart abandonment—can yield measurable revenue lifts within days, structured A/B tests require more time.
On average, an A/B test should run for at least two to four weeks to account for weekly traffic fluctuations (e.g., weekday vs. weekend buying patterns). To declare a statistically valid winner, your test must reach a minimum of 95% statistical significance and accumulate a sufficient sample size—typically at least 200 to 500 conversions per variant. Ending tests too early based on early trends is a common mistake that leads to false positives.
What are the most common CRO mistakes businesses make?
The most common mistakes we see include:
- Testing without research: Running experiments based on random ideas or competitor copying rather than actual user data.
- Testing too many variables at once: If you change the headline, the CTA button color, and the hero image all in one test, you won’t know which element caused the change in performance.
- Ignoring mobile users: Designing and QA-ing tests solely on desktop screens when the vast majority of your traffic arrives via mobile.
- Treating CRO as a one-time project: Optimization is not a “set-it-and-forget-it” task. It is an ongoing, compounding growth discipline. Sequential, incremental lifts of 8%, 10%, and 12% compound over time to deliver massive, permanent revenue gains.
Conclusion
At the end of the day, driving traffic to an unoptimized website is like pouring water into a leaky bucket. If you want to stop wasting your marketing budget, you must make conversion rate optimisation best practices a core pillar of your digital strategy.
By replacing guesswork with rigorous, data-driven experimentation, streamlining your mobile user experience, and systematically tackling conversion blockers, you can unlock massive growth from the traffic you already have.
At Kyle Eggleston SEO Consultant, we bring more than 20 years of personalized, results-driven digital marketing experience to local businesses in Chicago, Illinois, and across the United States. We don’t just focus on getting your business ranked on search engines; we ensure that when local customers find you, they are compelled to take action. From technical SEO audits to advanced conversion optimization, we build strategies tailored to your unique business goals.
Ready to stop leaving money on the table? Explore our comprehensive guide on SEO Best Practices or reach out to us today to schedule your personalized digital strategy consultation. Let’s work together to turn your website traffic into predictable, compounding revenue.

